Elseveir Infographics
- infographics
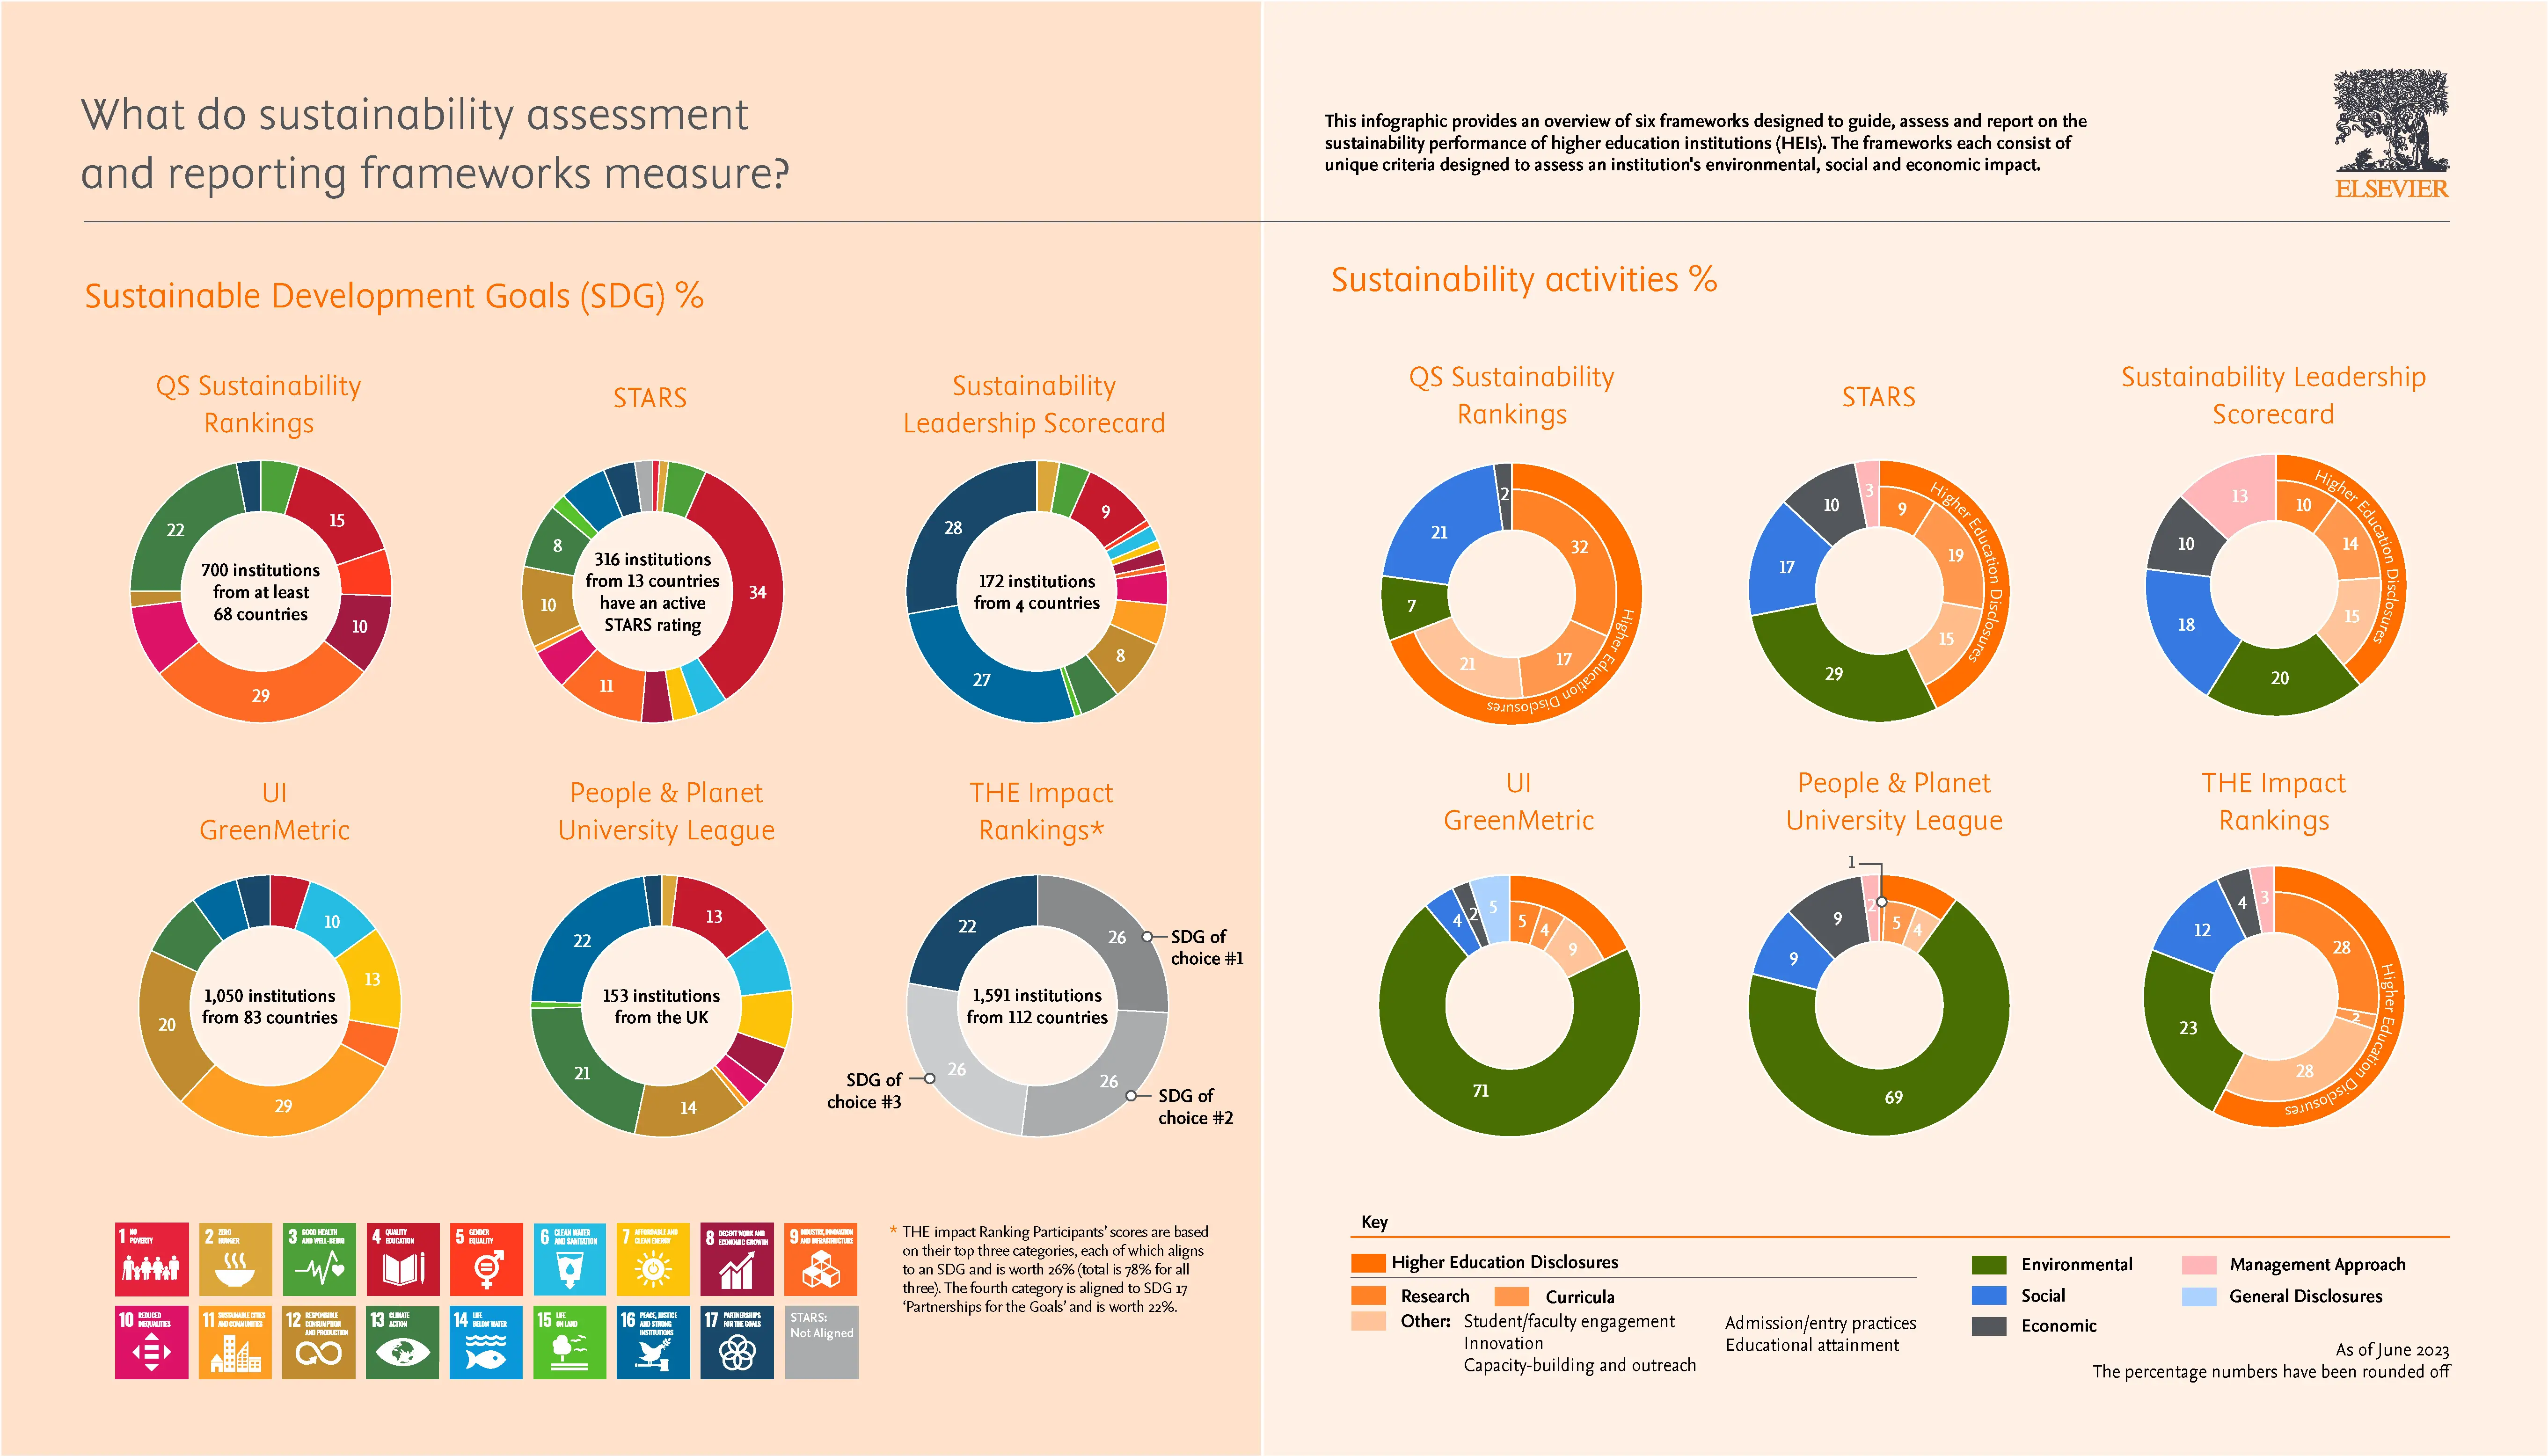
Having collaborated with Elsevier on the design of its The Power of Data to Advance the SDGs report, we were thrilled to be invited to create a master template for a series of dynamic and engaging infographics. These visuals were designed to effectively communicate findings from global studies and surveys, all tied to the United Nations Sustainable Development Goals.
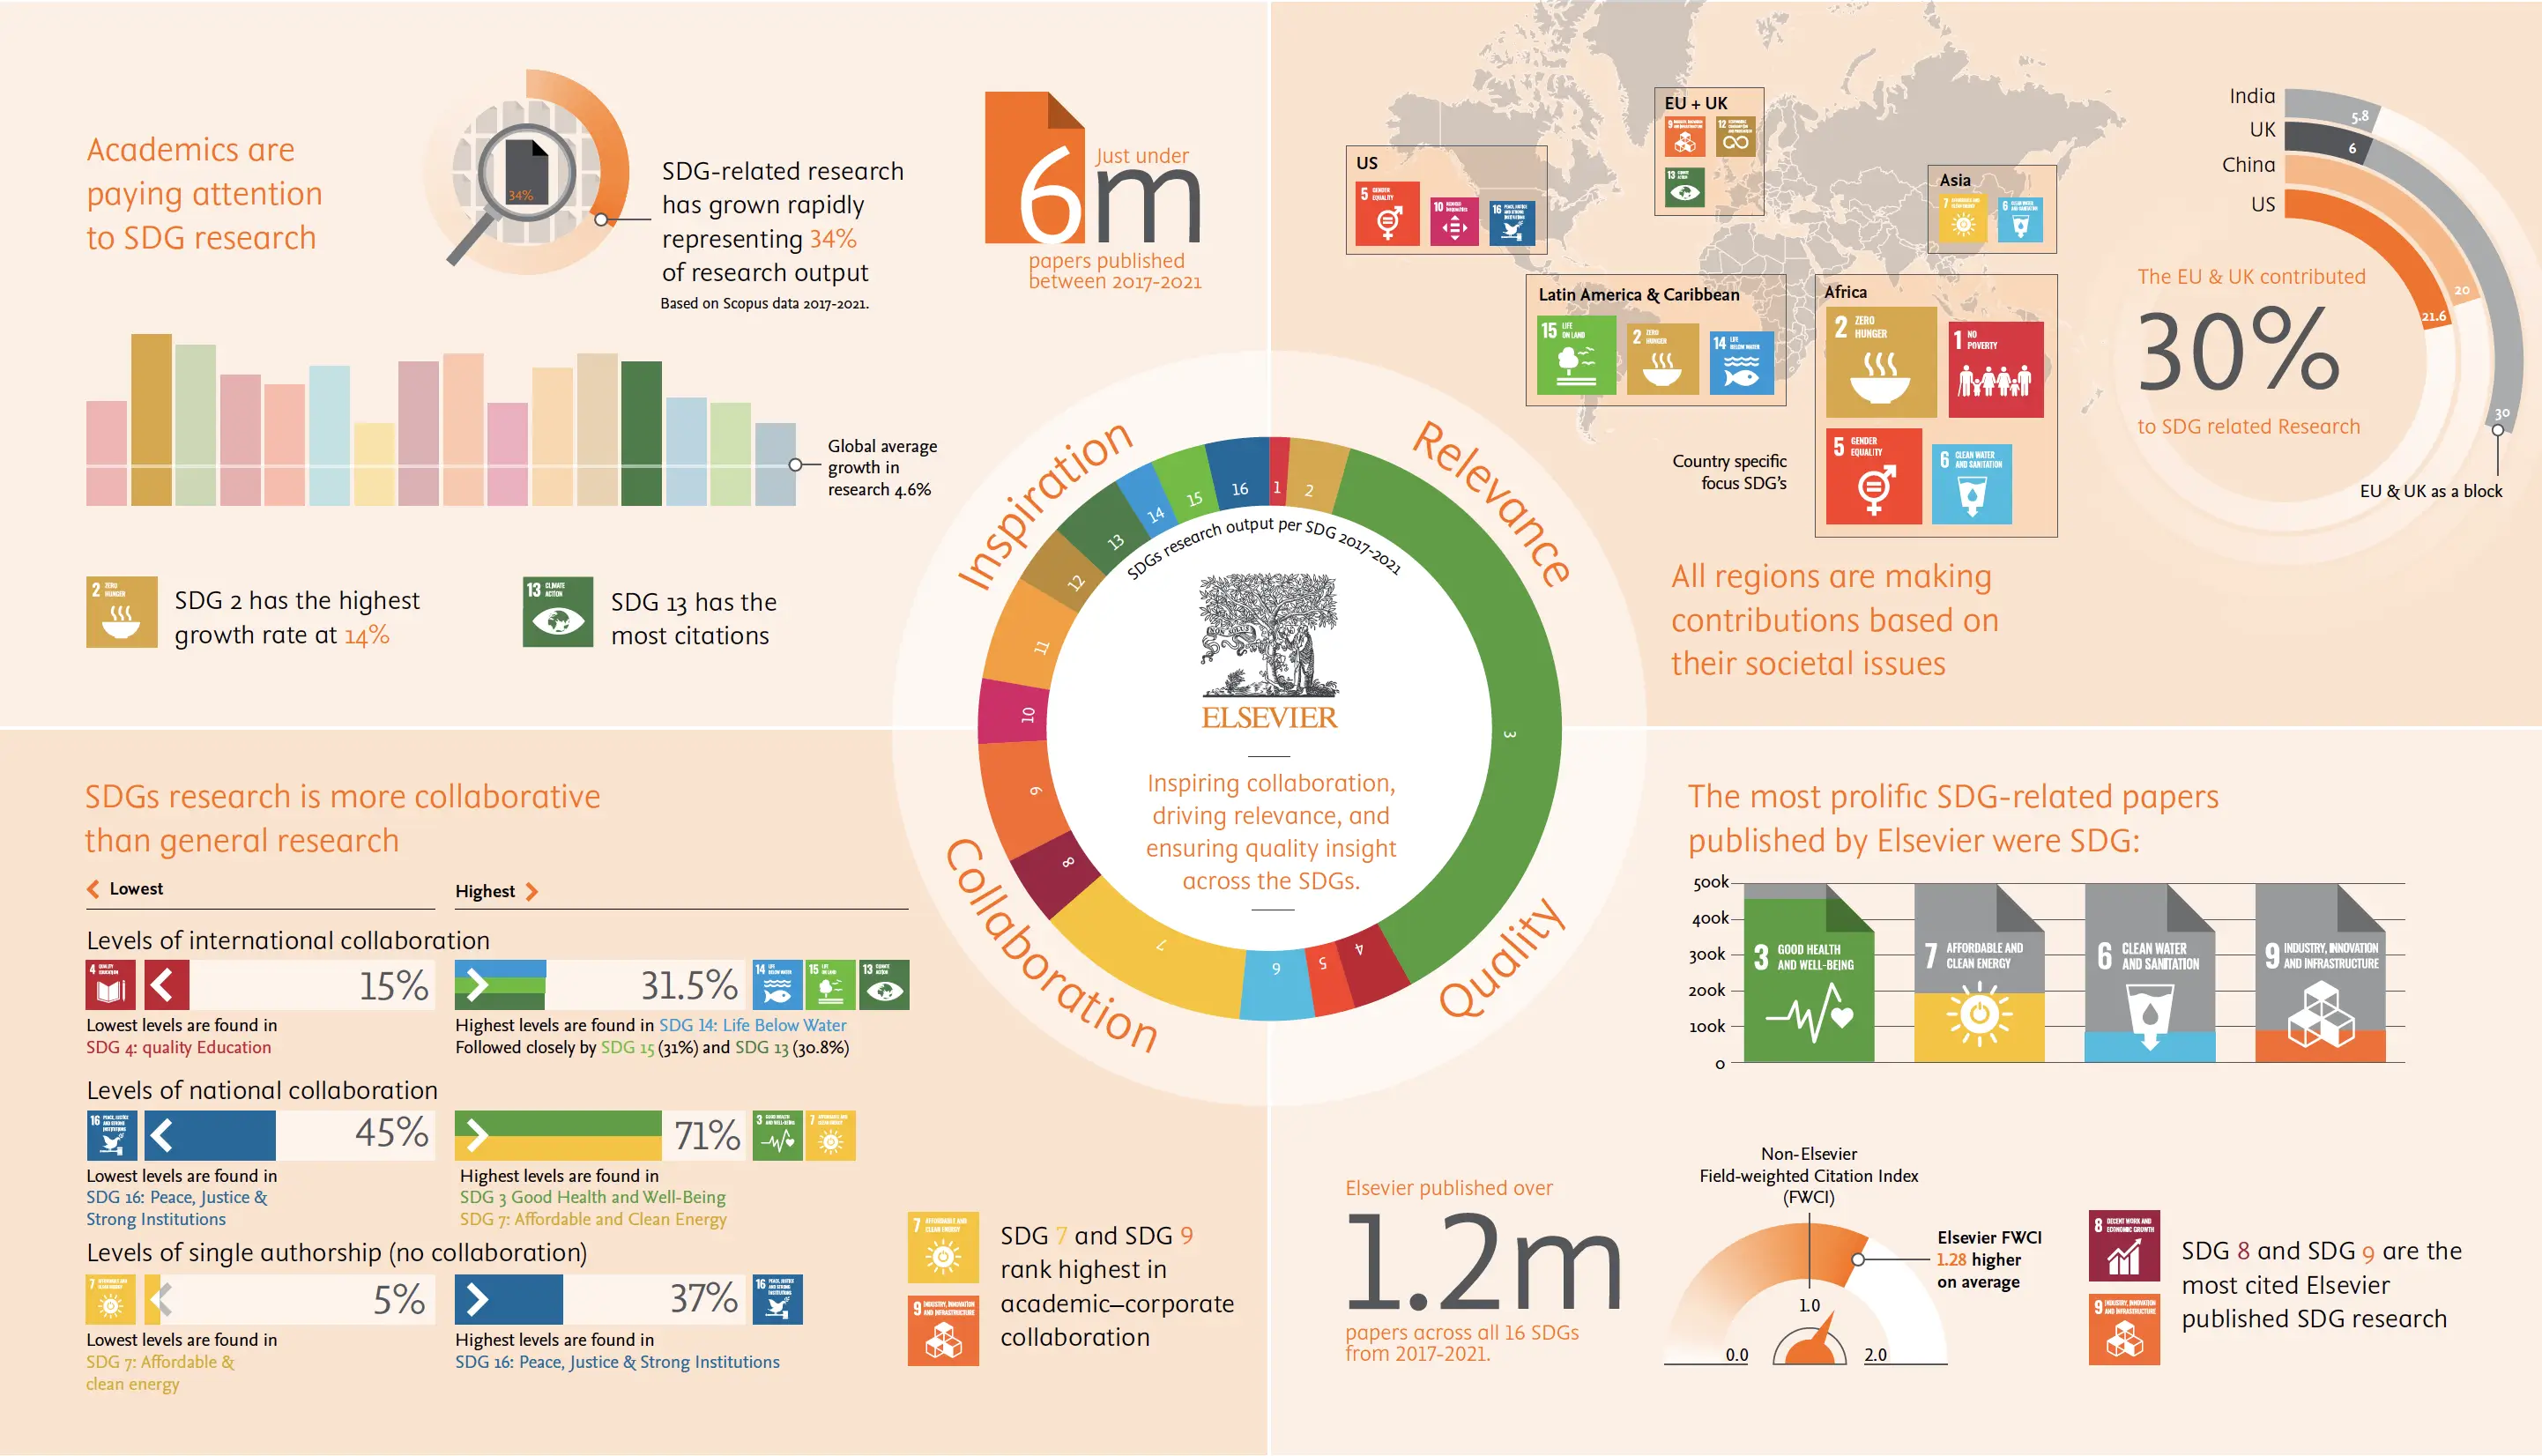
We were tasked with two briefs exploring different facets of research and analytics within the SDG space, collaborating with Elsevier to refine the approach and objectives. The infographics aimed to provide universities and academics with valuable insights into the global growth of countries excelling in SDG-related research. Who was leading progress? Who lagged behind? And what did these trends reveal about priorities and the overall health of engagement with the UN’s SDGs?
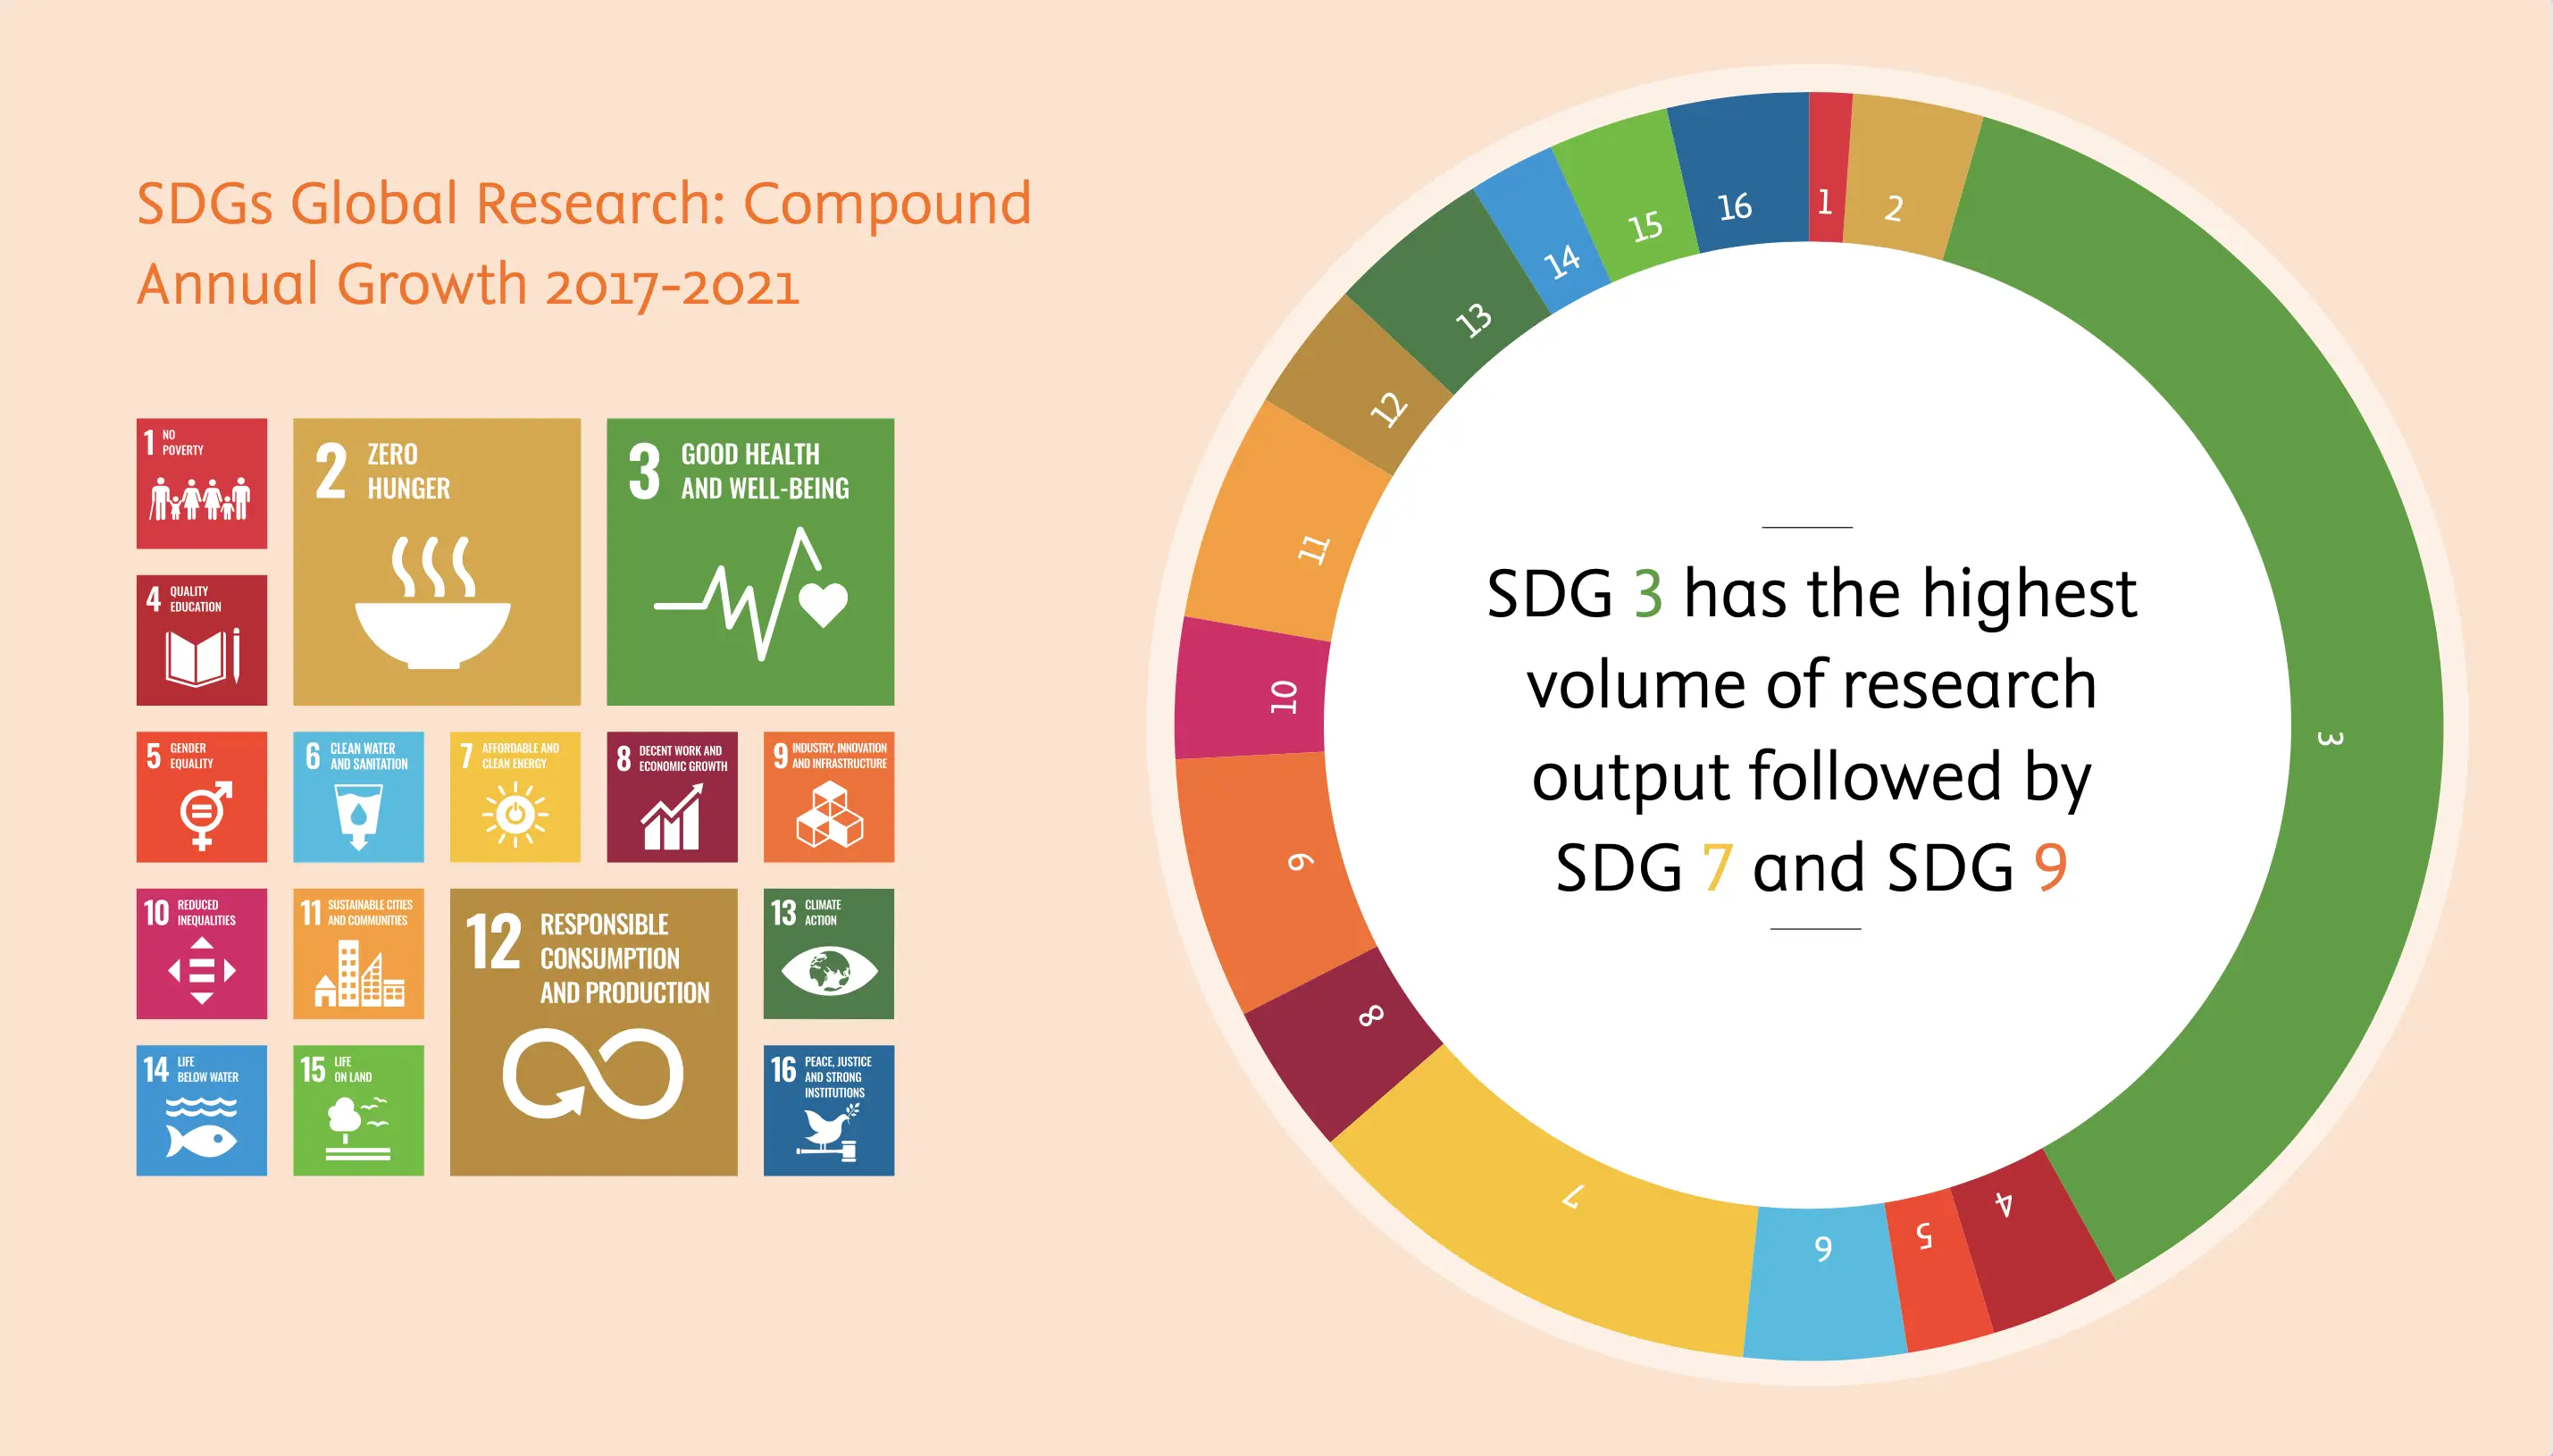
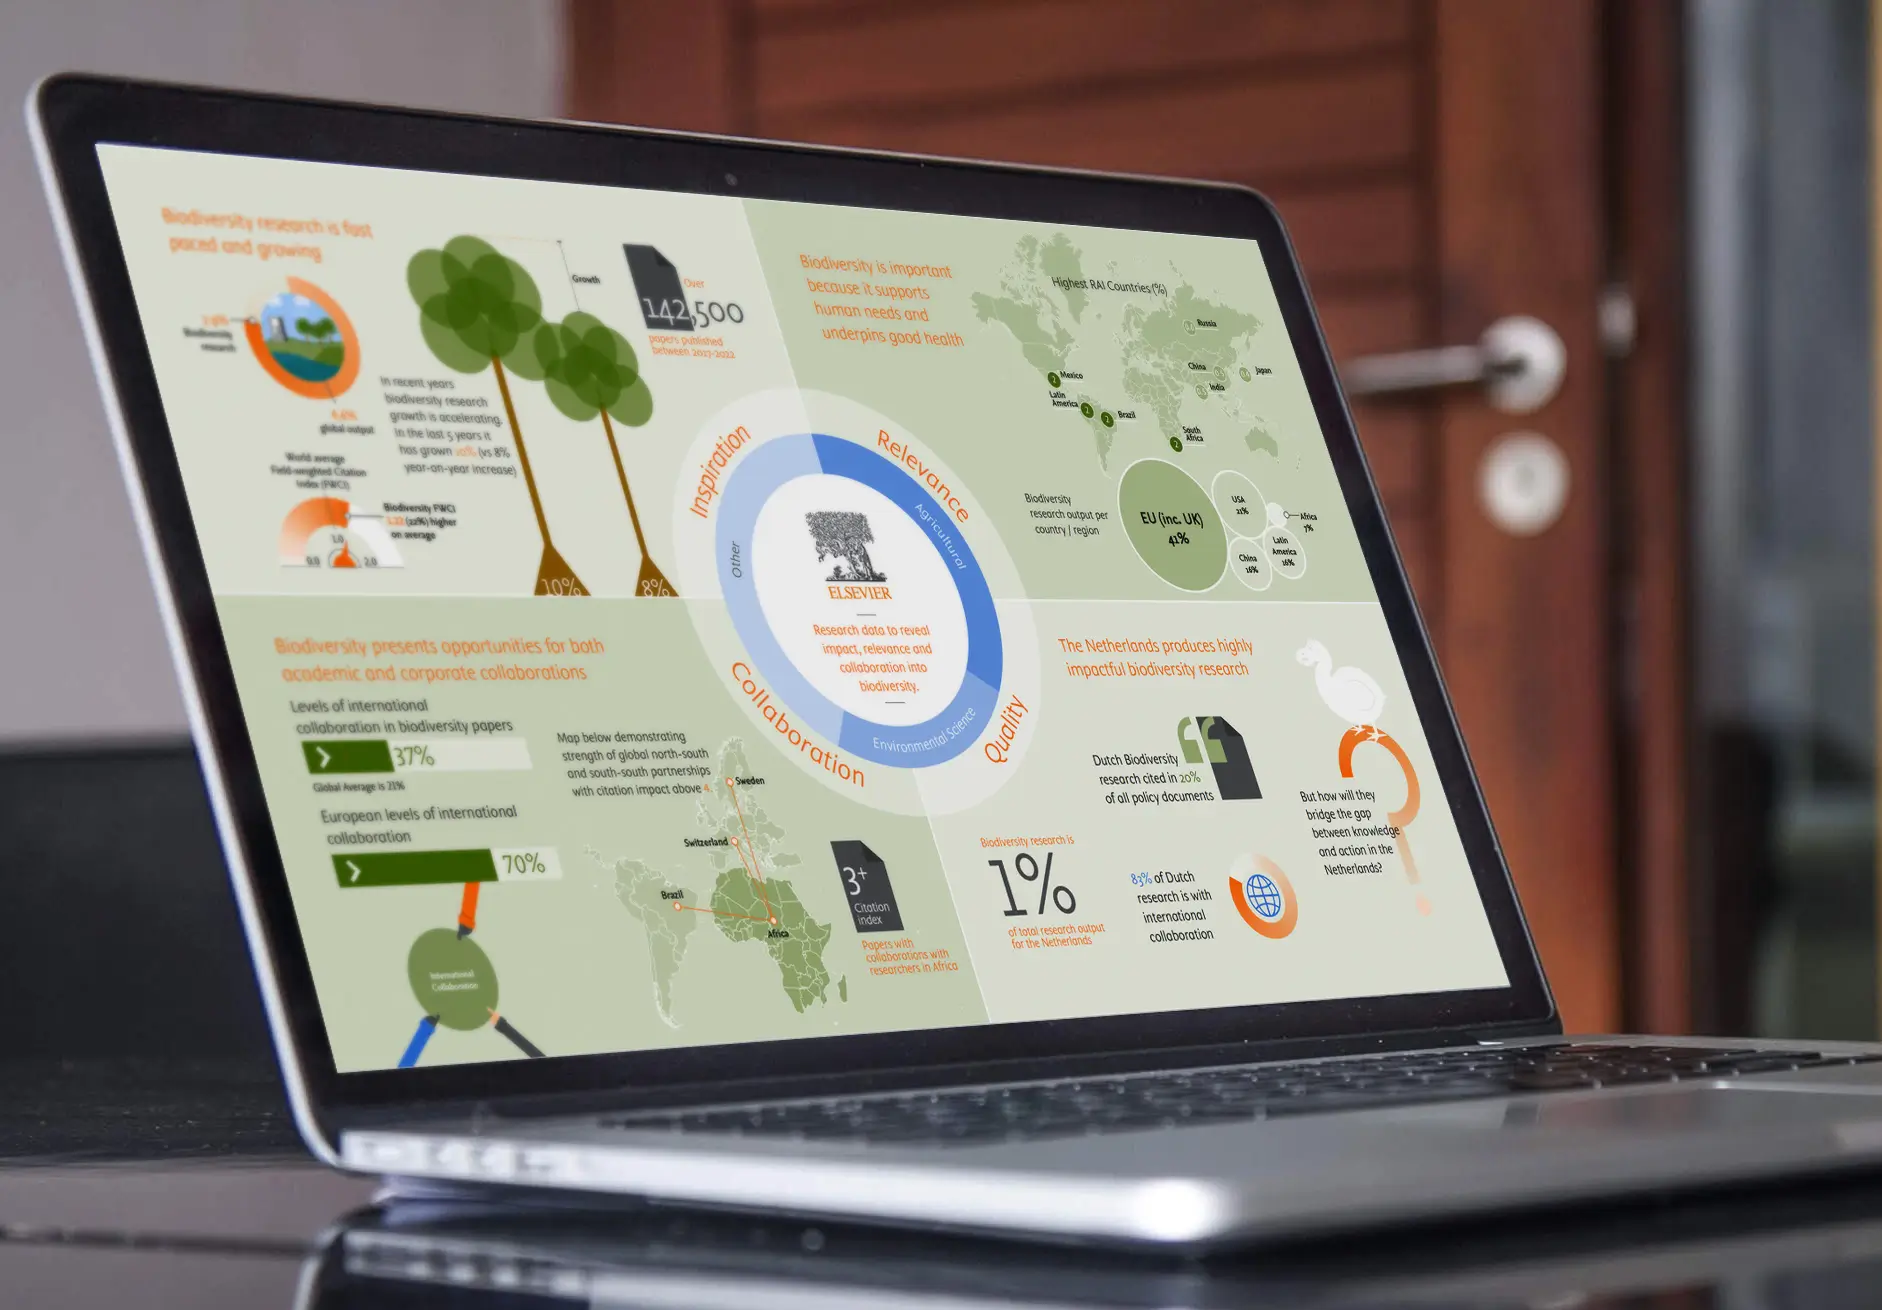
Our solution divided the content into four key sections, each distilled into a single defining word: Inspiration, Relevance, Quality, and Collaboration. These themes framed an overarching pie chart illustrating the global growth of SDG research, setting a clear and adaptable structure for future templates tailored to other sectors and research areas.


